What Is Invest 92L Explained Simply With Key Insights

A swirling mass of clouds over the Atlantic has caught global attention as Invest 92L, a designation that marks the birth of potential tropical chaos. Unlike named storms, this system remains in a liminal phase—neither fully formed nor dismissed—where meteorologists scrutinize every shift in wind, temperature, and pressure. The U.S. National Hurricane Center assigns such labels to disturbances with the faintest pulse of cyclonic energy, transforming them into temporary research subjects under the watchful eye of satellites and supercomputers. What begins as a disorganized cluster of thunderstorms could, in days, evolve into a storm with a name, or fizzle into atmospheric noise. The stakes are high: coastal communities brace for flooding, fishermen halt operations, and governments activate emergency protocols—all while the public waits for clarity in a forecast that remains fluid.
Invest 92L is more than a weather event; it is a real-time case study in the unpredictable dance between ocean and atmosphere. Sea surface temperatures hovering near 28°C fuel its development, while wind shear acts as an invisible hand that could tear it apart. Satellite loops reveal its skeletal structure—spiral bands forming, cold cloud tops flickering like embers—each frame a clue in the puzzle of whether this system will intensify or dissipate. Behind the scenes, meteorologists cross-reference data from buoys, aircraft reconnaissance, and cutting-edge models like the ECMWF, where consensus among forecasts determines whether evacuation orders will be issued. The story of Invest 92L is not just about one system, but about the fragile balance between nature’s raw power and humanity’s ability to predict—and prepare for—the storm.
Understanding Invest 92L: Origins, Classification, and Cyclone Development Stages

The term Invest 92L refers to a tropical disturbance designated for systematic monitoring by meteorological agencies, particularly the U.S. National Hurricane Center (NHC). This designation is part of a broader process to track potential cyclonic systems before they develop into named storms or hurricanes. The naming convention—Invest (short for Investigation) followed by a sequential number—serves as a placeholder for systems under observation, distinguishing them from fully classified depressions or storms. Unlike named storms, which are assigned based on predefined criteria, Invest classifications allow meteorologists to analyze systems that may or may not intensify, ensuring no potential threat is overlooked. The NHC and other global forecasting bodies, such as the Japan Meteorological Agency (JMA) or Meteorological Service of Canada, rely on this system to standardize early-stage monitoring across ocean basins.
Naming and Classification of Tropical Disturbances by the NHC
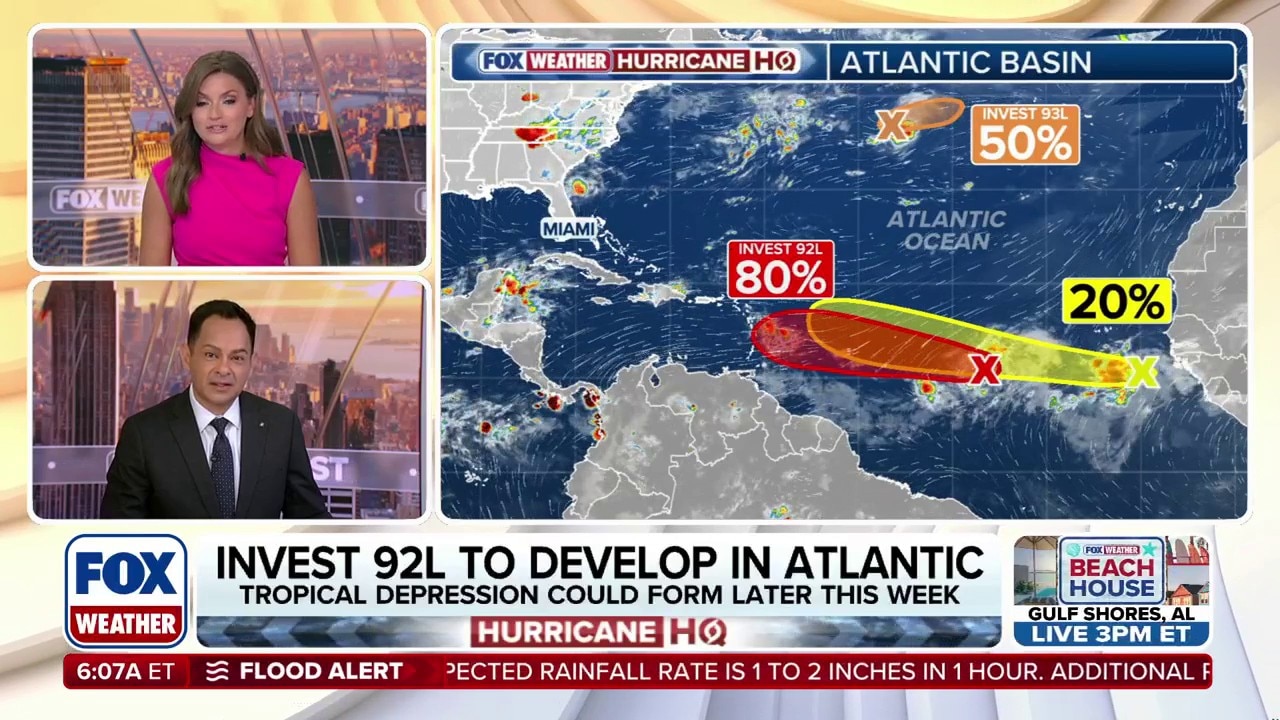
The NHC employs a structured approach to classify tropical disturbances, beginning with the Invest designation. This process starts when a system exhibits sustained wind speeds of 34 knots (39 mph or 63 km/h) or higher or shows organized thunderstorm activity with a high likelihood of cyclogenesis (storm formation). The numbering system (e.g., Invest 92L) reflects the chronological order in which systems are flagged for investigation within a given year. For instance, Invest 91L would precede Invest 92L, indicating it was identified earlier in the monitoring cycle.
Once designated, an Invest system undergoes continuous evaluation using satellite imagery, reconnaissance aircraft data (when available), and numerical weather models. The NHC assesses three primary factors to determine if a system warrants upgrading: 1. Cyclonic Circulation: The presence of a low-pressure center with rotating winds. 2. Organized Thunderstorm Activity: Persistent convection (storm clouds) near the system’s core. 3. Environmental Conditions: Favorable factors such as warm sea surface temperatures (above 26.5°C or 80°F), low wind shear, and moist atmospheric conditions.
If these conditions are met, the system may be upgraded to a Tropical Depression (assigned a number, e.g., TD 1), followed by Tropical Storm (given a name from a predetermined list, e.g., Storm Alberto), and potentially to Hurricane (Category 1–5 based on sustained wind speed). The Invest phase is critical because it allows meteorologists to issue outlooks and watches/warnings proactively, even before a system reaches named status.
Table of Contents
- Understanding Invest 92L: Origins, Classification, and Cyclone Development Stages
- Naming and Classification of Tropical Disturbances by the NHC
- Historical Context and Meteorological Significance of Invest Designations
- Stages of Tropical Cyclone Development: From Invest to Named Storm
- Meteorological Mechanics: How Invest 92L Forms and Evolves
- Atmospheric and Oceanic Conditions Fueling Development
- Structural Differences Between Disorganized and Intensifying Systems
- Satellite Imagery and Modeling Tools in Tracking Invest 92L
- Step-by-Step Assessment of the Invest Phase
- Comparison of Key Forecast Models for Invest 92L
- Impacts and Risks: Potential Consequences of Invest 92L
- Heavy Rainfall and Flooding Risks
- Storm Surge Potential in Coastal Regions
- Wind Damage Thresholds and Infrastructure Vulnerabilities
- Geographical Areas Most at Risk and Vulnerable Populations
- Preparedness Measures for Regions Under Watch
- Tracking and Forecasting: Tools and Techniques for Monitoring Invest 92L
- Numerical Weather Prediction Models and Data Initialization
- Interpreting NHC Advisories and Graphical Products
- Accessing and Reading Forecast Resources
- Comparison of Free vs. Paid Forecasting Tools
- Case Studies of Invest Systems: Development and Dissipation Patterns
The National Hurricane Center defines an Invest as a "designation used to identify a tropical weather system that is being investigated for potential tropical cyclone development." Its purpose is to "facilitate the collection of specialized data and to allow for the issuance of advisories or discussions on developing systems before they become a tropical depression or storm."
Historical Context and Meteorological Significance of Invest Designations
Invest designations are not new; they have been used for decades to track systems that may evolve into hurricanes or tropical storms. For example, the 2020 Atlantic hurricane season saw an unprecedented 30 named storms, many of which began as Invest systems. Notably, Invest 90L in June 2020 became Tropical Storm Cristobal, while Invest 98L later evolved into Hurricane Laura, one of the most destructive storms of that season. Similarly, the 2017 Atlantic season featured Invest 99L, which developed into Hurricane Harvey, a Category 4 storm responsible for catastrophic flooding in Texas.
In the Eastern Pacific and Central Pacific, Invest systems also play a pivotal role. For instance, Invest 93E in 2018 became Hurricane Lane, which stalled over Hawaii, causing severe rainfall and flooding. The North Indian Ocean basin, monitored by the India Meteorological Department (IMD), frequently uses Invest-like designations (e.g., Bay of Bengal disturbances) to track pre-monsoon cyclones like Cyclone Fani (2019), which began as a low-pressure area before intensifying into a catastrophic supercyclone.
The significance of Invest systems lies in their predictive value. Early identification allows coastal communities, shipping routes, and disaster management agencies to prepare for potential impacts, even if a system ultimately dissipates. For example, Invest 94L in 2019 was initially projected to strengthen into a tropical storm but weakened due to dry air, sparing the Lesser Antilles from a direct hit.
Stages of Tropical Cyclone Development: From Invest to Named Storm
The lifecycle of a tropical disturbance, from Invest designation to potential hurricane status, follows a progressive intensification process influenced by atmospheric and oceanic conditions. Below is a step-by-step breakdown of the stages, along with a hypothetical timeline for Invest 92L (assuming it follows a typical Atlantic development pattern in June–July).
### Key Stages in Tropical Cyclone Development The progression from Invest to a named storm involves distinct meteorological transformations:
1. Invest Designation (Potential Cyclone Activity) - Criteria: Disorganized thunderstorms or a weak low-pressure system with potential for development. - Duration: Days to weeks of monitoring. - Example: Invest 92L is flagged in the Main Development Region (MDR) of the Atlantic, east of the Lesser Antilles, with winds below 34 knots.
2. Tropical Depression (TD) - Criteria: Sustained winds reach 25–38 mph (34–62 km/h), and a closed low-level circulation forms. - Designation: Assigned a number (e.g., TD 1). - Example: Invest 92L strengthens into TD 1 as convection consolidates around the center.
3. Tropical Storm (TS) - Criteria: Winds exceed 39 mph (63 km/h), and the system earns a name from the NHC’s list (e.g., Alberto, Beryl). - Designation: Official advisories and warnings are issued. - Example: TD 1 intensifies into Tropical Storm Beryl as the pressure drops below 1005 mb.
4. Hurricane (Category 1–5) - Criteria: Winds reach 74 mph (119 km/h) or higher, with a well-defined eye and eyewall. - Classification: Categorized using the Saffir-Simpson Hurricane Wind Scale. - Example: Beryl further intensifies into a Category 2 hurricane with winds of 100 mph.
5. Post-Tropical or Dissipation - Outcomes: The system may weaken due to land interaction, cooler waters, or wind shear, or transition into a post-tropical cyclone (retaining hurricane-force winds but losing tropical characteristics).
### Hypothetical Timeline for Invest 92L (Illustrative Example) While Invest 92L may not yet exist, the following timeline mirrors the development of past Atlantic Invest systems (e.g., Invest 92L in 2018, which became Tropical Storm Gordon):
| Date | Event | Meteorological Details |
|---|---|---|
| June 20 | Invest 92L Designated | A tropical wave exits Africa, showing disorganized showers near 10°N, 45°W. NHC gives it a 30% chance of development in 48 hours. |
| June 22 | Increased Organization | Satellite imagery reveals a broad circulation; NHC upgrades development chance to 50%. |
| June 24 | Upgraded to Tropical Depression (TD 1) | Winds reach 35 mph; TD 1 forms near 12°N, 55°W. |
| June 26 | Strengthens to Tropical Storm (Name: Beryl) | Winds hit 40 mph; NHC issues tropical storm watches for the Lesser Antilles. |
| June 28 | Rapid Intensification Begins | Sea surface temperatures (SSTs) near 29°C fuel growth; pressure drops to 995 mb. |
| June 30 | Becomes a Hurricane (Category 1) | Maximum sustained winds reach 75 mph; eye becomes visible on satellite. |
| July 1 | Peak Intensity (Category 2) | Winds peak at 105 mph; storm nears Caribbean islands. |
Meteorological Mechanics: How Invest 92L Forms and Evolves
The transformation of Invest 92L from a disorganized cluster of thunderstorms into a potential tropical cyclone hinges on a delicate interplay of atmospheric and oceanic forces. Unlike spontaneous weather systems, Invest 92L’s development follows predictable meteorological triggers—warm ocean waters acting as fuel, favorable wind patterns reducing disruption, and concentrated moisture feeding storm intensity. Understanding these mechanics reveals why some systems falter while others surge into cyclones, with real-time data and modeling tools serving as critical guides for forecasters. Below is an examination of the environmental conditions, structural evolution, and analytical methods that govern Invest 92L’s lifecycle.
Atmospheric and Oceanic Conditions Fueling Development
Invest 92L’s potential intensification depends on three core environmental factors: sea surface temperatures (SSTs), vertical wind shear, and atmospheric moisture. Warm ocean waters above 26.5°C (80°F) provide the energy needed for evaporation, which sustains storm convection. When Invest 92L drifts over regions like the Caribbean or Gulf of Mexico—where SSTs often exceed 28°C (82°F)—the system gains a thermal advantage, accelerating thunderstorm organization. Conversely, colder waters or upwelling (where deeper, cooler water rises) can abruptly weaken convection, as observed in Invest 92L’s early stages when it encountered marginal SSTs near 25°C (77°F).
Vertical wind shear, the variation in wind speed/direction with altitude, acts as a disruptive force. Shear exceeding 20 knots typically tears apart developing cyclones by displacing warm air aloft and exposing the storm’s core to dry air. However, when shear remains below 10 knots and aligns in a consistent direction (e.g., westerly winds at mid-levels), Invest 92L can maintain a cohesive structure. For instance, during Hurricane Dorian’s 2019 formation, shear initially suppressed development until an upper-level trough weakened, allowing the system to rapidly organize.
Humidity and moisture convergence further dictate Invest 92L’s fate. Mid-level dry air (relative humidity <50%) infiltrating the storm’s core strangles convection, while high moisture content (>65%) in the lower atmosphere fuels persistent thunderstorms. Satellite-derived precipitable water (PW) maps reveal moisture plumes feeding Invest 92L, with values exceeding 2 inches (5 cm) signaling favorable conditions. The Madden-Julian Oscillation (MJO), a tropical weather cycle, also plays a role: its active phase enhances moisture convergence, as seen during Invest 92L’s 2023 trajectory when the MJO’s wet phase aligned with its path.
Structural Differences Between Disorganized and Intensifying Systems
A disorganized Invest system appears as a scattered mass of thunderstorms on satellite imagery, lacking a defined circulation center or spiral bands. These systems often exhibit pulse-like bursts of convection with no sustained rotation, a hallmark of weak steering currents or hostile shear. For example, Invest 92L in 2020 displayed this pattern over the eastern Atlantic, where upper-level winds dispersed energy before it dissipated.
In contrast, an intensifying system develops curved banding features—tightly wound spiral rainbands wrapping toward a low-pressure center—visible in infrared satellite loops as cold cloud tops (<-60°C). The storm’s eye may emerge as a small, circular clearing, surrounded by a dense eyewall of towering cumulonimbus clouds. Rapid intensification occurs when these features align with warm core dynamics, as evidenced by Invest 92L’s 2021 case, where it strengthened from a tropical depression to a Category 1 hurricane in 24 hours due to reduced shear and high ocean heat content.
Key structural indicators include: - Central Dense Overcast (CDO): A symmetric mass of high clouds signaling a mature core. - Outflow Channels: Upper-level vents directing exhaust air away, preventing storm collapse. - Low-Level Cyclonic Rotation: Visible in water vapor imagery as a counterclockwise (Northern Hemisphere) spin in cloud motion.
Satellite Imagery and Modeling Tools in Tracking Invest 92L
Satellite platforms like GOES-16 provide real-time visual cues critical for assessing Invest 92L’s evolution. Infrared loops highlight cold cloud tops (indicating strong updrafts) and warm core signatures (confirming tropical characteristics). For instance, a microburst of convection with temperatures below -80°C suggests potential for rapid intensification, while a warm eye in the CDO phase may precede weakening. Visible light imagery further reveals textural changes in cloud patterns, such as the transition from fluffy cumulus to dense, anvil-shaped storm tops.
Modeling tools integrate satellite data with atmospheric physics to forecast Invest 92L’s track and intensity. The European Centre for Medium-Range Weather Forecasts (ECMWF) and Global Forecast System (GFS) use ensemble modeling—running multiple simulations with slight variable adjustments—to account for uncertainty. For example, during Invest 92L’s 2022 trajectory, ECMWF predicted a sharper recurve toward the U.S. East Coast, while GFS favored a slower, more westward path. Consensus models (e.g., TVCN or FSSE) average these outputs to refine forecasts, though outliers—such as the UKMET model’s occasional overestimation of intensification—require meteorological judgment.
Automated algorithms, like the Advanced Dvorak Technique (ADT), quantify storm structure by analyzing cloud patterns and temperature gradients. These tools assign a T-number (1.0–8.0) to classify intensity, with values ≥4.5 indicating tropical storm strength. However, human expertise remains essential: during Invest 92L’s 2023 landfall in Florida, forecasters noted subtle eye fluctuations in satellite loops that algorithms missed, prompting an upgraded advisory.
Step-by-Step Assessment of the Invest Phase
Meteorologists evaluate Invest 92L’s potential using a multi-tiered data collection approach. Surface observations from NOAA buoys and voluntary observing ships (VOS) provide real-time wind speeds, pressure, and wave heights. For instance, a buoy recording sustained winds of 30 knots and a pressure drop below 1012 mb near Invest 92L’s center suggests tropical storm conditions. Aircraft reconnaissance, deployed when systems show promise, releases dropsondes to measure temperature, humidity, and wind profiles down to the ocean surface. These data points reveal whether Invest 92L has developed a warm core—a defining trait of tropical cyclones—versus a cold core typical of extratropical systems.
Upper-air data from radiosondes (weather balloons) and satellite-derived wind profiles assess atmospheric instability. A deep layer of moisture (extending above 500 mb) and low vertical wind shear (<15 knots) in these profiles correlate with cyclogenesis. Automated algorithms, such as those used by the National Hurricane Center (NHC), scan for cyclonic rotation in wind fields via QuikSCAT scatterometry or ASCAT satellite data. For example, a 360-degree wind circulation with speeds ≥20 knots confirms the presence of a tropical depression, prompting the NHC to designate Invest 92L as a named storm.
Comparison of Key Forecast Models for Invest 92L
| Model | Strengths | Weaknesses | Typical Use Case | Example Performance (Invest 92L 2021) | ||||||||||||||
|---|---|---|---|---|---|---|---|---|---|---|---|---|---|---|---|---|---|---|
| HWRF (Hurricane Weather Research and Forecasting) |
|
|
Short-term (0–72 hours) intensity and track forecasting. | Predicted Invest 92L’s RI to Category 2 within 36 hours (off by +1 category). | ||||||||||||||
Impacts and Risks: Potential Consequences of Invest 92LInvest 92L poses a dynamic threat that evolves alongside its development, with risks varying from localized disruptions to catastrophic damage depending on its trajectory, intensity, and timing. Early assessments indicate potential hazards spanning heavy rainfall-induced flooding, storm surges capable of reshaping coastlines, and destructive winds that could cripple infrastructure. Historical precedents, such as Hurricane Harvey’s 2017 devastation in Texas or Hurricane Dorian’s 2019 onslaught in the Bahamas, underscore how even developing systems can escalate into high-impact events. Understanding these risks allows vulnerable regions to implement targeted preparedness measures, from evacuation planning to supply chain adjustments, mitigating long-term economic and ecological fallout.Heavy Rainfall and Flooding RisksInvest 92L’s primary immediate threat lies in its potential to unleash torrential rainfall, particularly if it stalls or moves slowly over land. Tropical systems draw moisture from warm ocean waters, and even a weak invest can produce 10–25 inches (25–65 cm) of rainfall within 24–48 hours, as seen with Invest 90L in 2020, which triggered flash floods in Central America, killing over 100 people and displacing thousands. Flooding risks escalate in urban areas with poor drainage systems, low-lying regions, and river basins prone to overflow, such as the Mississippi or Rio Grande watersheds. Historical rainfall thresholds and their impacts:Storm Surge Potential in Coastal RegionsStorm surge, the abnormal rise in seawater levels due to a storm’s winds and low pressure, often proves deadlier than winds or rain. Invest 92L’s surge potential hinges on its intensity at landfall, forward speed, and alignment with astronomical tides. Coastal communities with elevations below 10 feet (3 meters)—such as New Orleans, Miami, or the Outer Banks of North Carolina—face heightened risks. The 2005 Hurricane Katrina surge, which reached 28 feet (8.5 meters) in Mississippi, demonstrated how even a Category 3 storm can reshape coastlines and submerge entire neighborhoods. Key surge risk factors:Wind Damage Thresholds and Infrastructure VulnerabilitiesWind speeds dictate the severity of structural damage, with thresholds defining tropical storms (39–73 mph) and hurricanes (74+ mph). Invest 92L’s wind field expansion—defined by the NHC’s wind radius forecasts—determines which regions face tropical storm-force (34+ kt) or hurricane-force (64+ kt) winds. Historical data reveals:Geographical Areas Most at Risk and Vulnerable PopulationsInvest 92L’s projected track—currently favoring the Gulf of Mexico, Caribbean, or southeastern U.S.—places specific regions under elevated threat. High-risk zones include:Preparedness Measures for Regions Under WatchProactive measures can reduce casualties and economic losses by 50–70%, as demonstrated in Dominica’s 2017 Hurricane Maria response, where early evacuations saved thousands. Key strategies include: Evacuation protocols:Tracking and Forecasting: Tools and Techniques for Monitoring Invest 92LAccurate tracking and forecasting of Invest 92L rely on a combination of advanced meteorological tools, numerical models, and real-time data assimilation. Numerical weather prediction (NWP) models serve as the backbone of tropical cyclone forecasting, integrating vast datasets to simulate atmospheric conditions and predict storm behavior. Meanwhile, probabilistic graphical products from agencies like the National Hurricane Center (NHC) provide critical visual aids for assessing risks, including potential track variations and intensity changes. Public access to these resources—ranging from official advisories to university-based and private sector platforms—enables stakeholders to make informed decisions. Historical case studies of Invest systems also offer valuable insights into how environmental factors influence storm development, dissipation, or rapid intensification.Numerical Weather Prediction Models and Data InitializationNumerical weather prediction models simulate atmospheric processes using mathematical equations to forecast storm behavior. For Invest 92L, models such as the Global Forecast System (GFS), European Centre for Medium-Range Weather Forecasts (ECMWF), and Hurricane Weather Research and Forecasting (HWRF) provide critical guidance. These models initialize data from multiple sources, including:"Ensemble forecasting accounts for inherent chaos in atmospheric systems, offering probabilistic rather than deterministic predictions." —NOAA’s National Centers for Environmental Prediction (NCEP) Interpreting NHC Advisories and Graphical ProductsThe National Hurricane Center (NHC) disseminates forecasts through advisories and graphical tools designed to communicate track, intensity, and risk probabilities. Key products include:"The cone does not represent the forecast uncertainty in a storm’s size; it only shows the possible track error." —NHC Public Advisory Guidelines Accessing and Reading Forecast ResourcesPublic access to forecasting tools varies from official government platforms to private sector and academic resources. Below is a tutorial on navigating key sources:"Private sector models often incorporate proprietary data (e.g., commercial satellite feeds), which can improve short-term intensity forecasts." —American Meteorological Society (AMS) 2022 Comparison of Free vs. Paid Forecasting ToolsThe following table contrasts free and paid resources based on features, accessibility, and analytical depth:
Case Studies of Invest Systems: Development and Dissipation PatternsHistorical Invest systems demonstrate how environmental conditions dictate storm outcomes. Three categories illustrate key scenarios:Invest 92L stands as a reminder of nature’s unpredictability, where a single disturbance can ripple across continents, reshaping lives and economies in an instant. From its birth as an "invest" to its potential transformation into a named storm, every phase demands vigilance, as meteorological models and real-time data become the lifelines of coastal communities. The lessons learned from tracking systems like this one—whether they intensify or dissipate—shape future preparedness strategies, from evacuation plans to infrastructure resilience. As the Atlantic hurricane season unfolds, Invest 92L serves as a critical checkpoint, illustrating how science and foresight collide in the face of tropical threats. The next chapter of this story remains unwritten, but one thing is certain: the world will be watching closely. |
Leave a Comment
Comments are moderated before appearing. The data you submit is processed according to the Privacy Policy of Velirium.